

26 Mar more wind capacity equals higher costs
Kansas has more industrial wind turbines than any other state. Since 2002, the wind energy component went from 2% to 36% of the net generating capacity for the state. I am using Kansas as the example to since it is the most extreme case in the United States so far, with regard to increasing wind energy capacity, and increasing retail electricity costs.
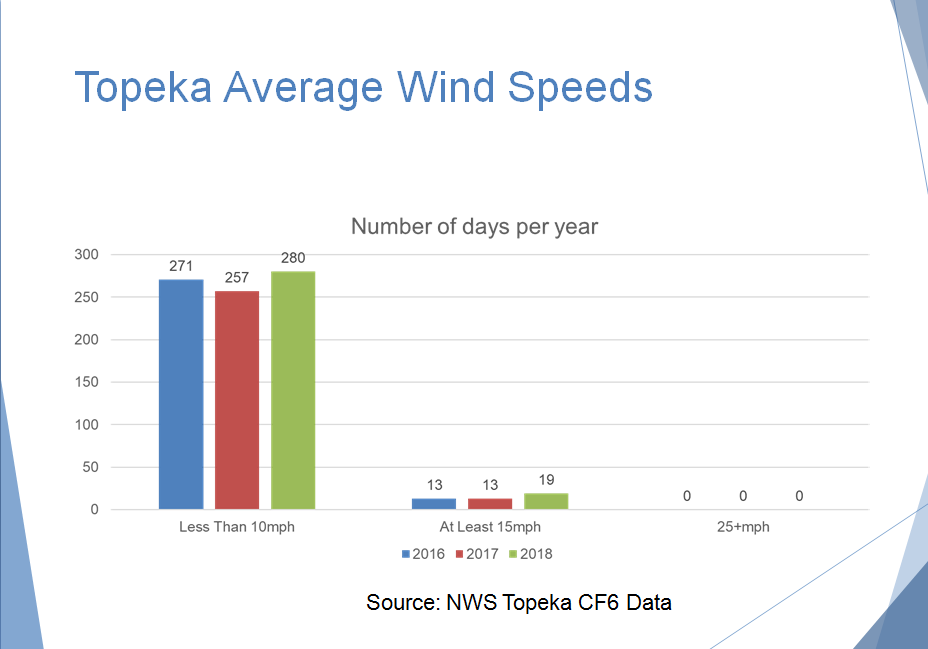
Just to be clear, generating capacity does not equal actual electrical generation when it comes to wind. As you know, the wind does not blow all the time. In fact, across the state of Kansas, the wind is not strong enough to generate any electricity anywhere from 136 days in the western part of the state to as many as 280 days per year in the eastern sections.,,based on average daily wind speeds. I have done studies for numerous locations and used an average daily wind speed under 10 mph as a benchmark for the lack of wind generation as the cut-in speeds for most industrial turbines is under 10 mph. That means, for wind under 10 mph the turbines require an electric motor to initiate the turning of the blade…therefore expending electricity rather than creating it.
Here is one three year study from Topeka, Kansas showing the number of days that the average daily wind speed is less than 10 mph. I also included the number of days where the average daily wind speed is over 25mph…which is the wind speed required to fully realize the generating capacity of the industrial sized turbines. From the chart you will see that it is rare that there are days when the wind blows all day at speeds that would produce the full capacity of an industrial turbine.
There are a number of other reasons that wind energy drives up the cost of electricity, including the need for extra transmission lines, extra land lease costs, extra fossil fuel generating capacity (equal to the amount of capacity added by wind), and the fact that when the wind does generate electricity it forces the wholesale price downward…sometimes to the point that our base load plants which we rely on for our electricity 24/7…operate at a loss. It is a complex situation that takes time and study to understand.
The graphs below from the Energy Information Agency, show the net generating capacity of other sources of electricity in Kansas. First, coal has been steadily dropping since 2002:
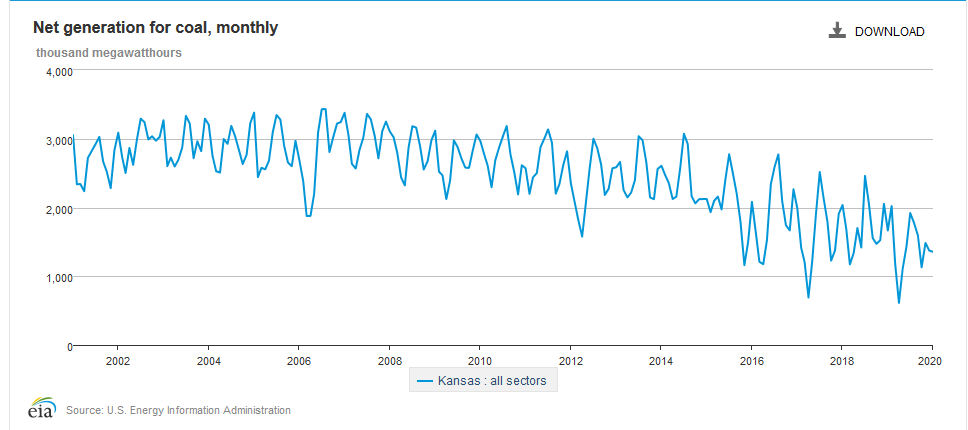
The one nuclear plant in Kansas, Wolf Creek, has been in operation since 1985 and will continue to operate until 2045. It produces electricity 24 hours a day, 7 days a week, except for outage periods for maintenance that happen once every two years. (That accounts for the dip in the graph below at two-year intervals) It’s annual output is 10,648 GWh which is at least 19 times more than the entire fleet of wind turbines in Kansas…that operate sporadically.
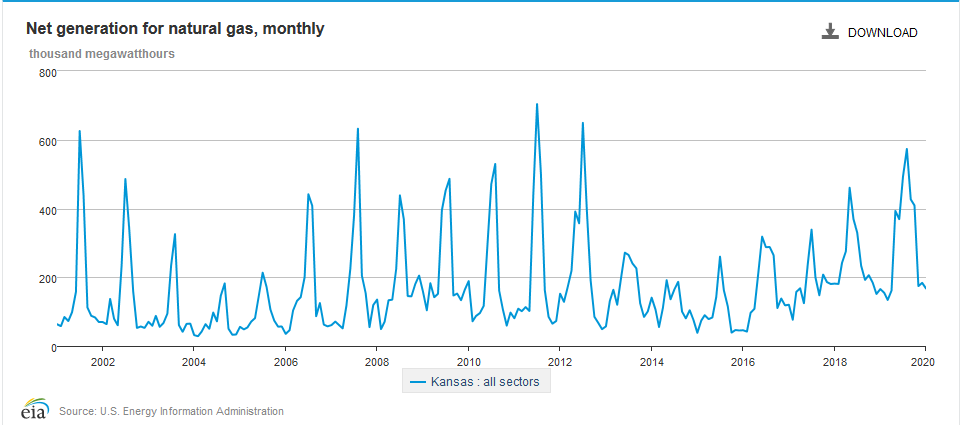
Natural Gas has shown a slight increase in capacity over recent years, but that is because natural gas generating capacity is needed as a back up for wind power.
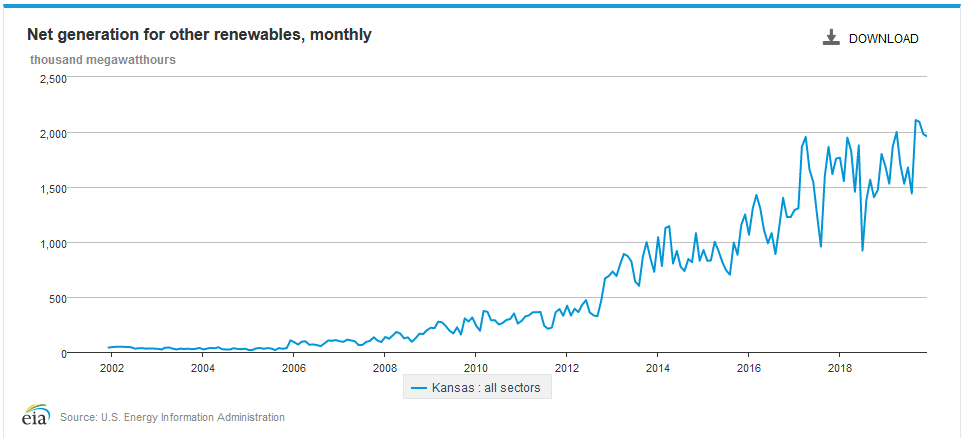
So while other generating sources in Kansas have remained nearly static, the amount of wind capacity is what has grown rapidly since 2002. By the way there is only hydroelectric plant in Kansas (near Lawrence) and no industrial solar capacity…so the graph below essentially represents the increase in wind turbine capacity:
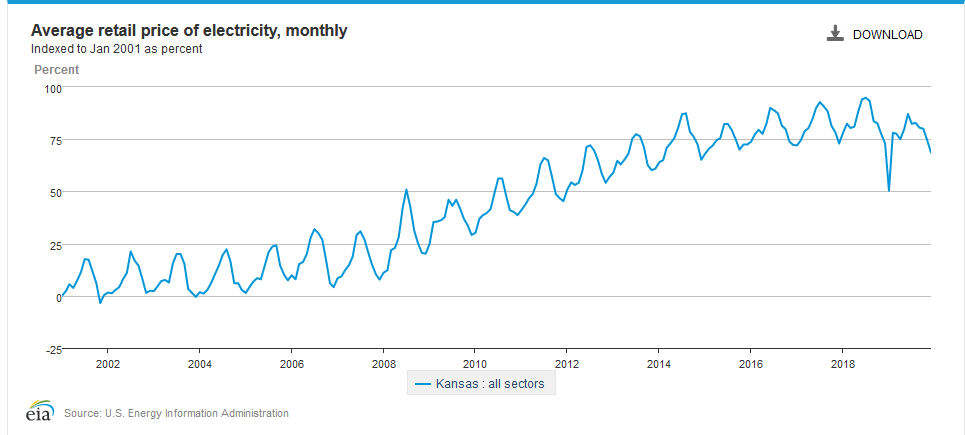
So what has happened to electrical rates in Kansas due to the increase in renewables (wind)? The graph below tells the tale. Rates in Kansas rose from below the national average in 2002 to above the national average now. Kansas households have experienced a nearly 75% increase in their energy bills!
If wind could produce power 24/7 and could be dispatched at a moments notice it might be worth considering. But as it stands, wind energy supplants investment into energy sources that we rely on daily. We cannot afford to continue to add non-dispatchable power sources such as wind and solar, in hopes ofreplacing nuclear, natural gas, coal, and oil….unless we want to run our homes on candlelight.